Row Differences
Excel has a very important function to find out differences between various rows. The function is called Row Differences.To access the function
- Shortcut key - Press Ctrl+G.
- Click Special
- Under Home Tab click 'Find & Select'.
- Click Go to Special.
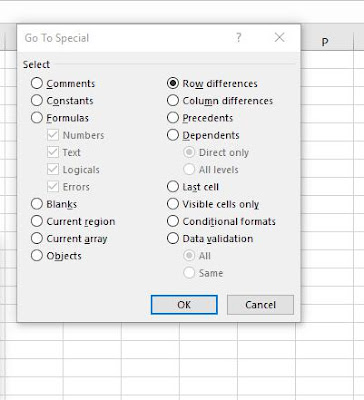 |
| ILL 1 Row Differences Option |
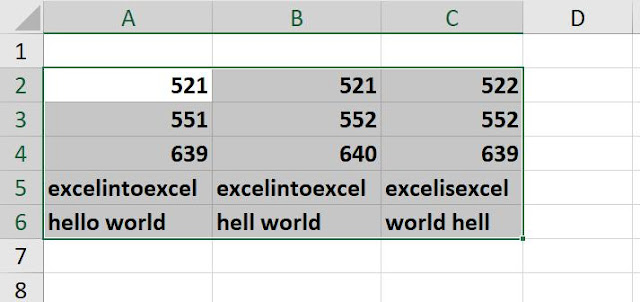 | |
| ILL 2 Data Range |
You are requested to go through the above selected data range. Where A2 cell (White cell in the range) is default active. You can observe the various differences of data from one cell to another but mostly row wise. Of course some are common.
After highlighting the data range.
Procedure
- Press Ctrl+G (Instead use Find & Select).
- Click 'Special'.
- Highlight the radio button associated with 'Row Differences'.
- Click Ok.
Result is as follows:
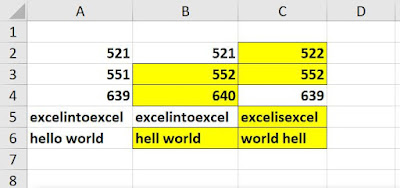 |
| Result |
Explanations:
In the 2nd row content of cell C2 is different from cells A2 & B2.
One can argue that the content of cell A3 is different from cell contents of B3 & C3. So why B3 & C3 is highlighted? Why not A3? Since B3 & C3 are similar and A3 is dissimilar.
Lets observe the data range (ILL 1) once again.
We can see that the default active cell is A2 (white), so the basis for comparison starts from column A.
According to the logic since the content of cells B3 & C3 are different from content's of cell A3, hence B3 & C3 has been selected.
The basis can be shifted by pressing Tab key (shifting the active white cell). Result would be different.
Again
Shifting the active cell to cell B3
Result
Explanations:
Since the basis of comparison is shifted to cell B3, result is different from previous one.Here A3 cell's content is different from B3's content (basis) and C3's content, hence A3 has been highlighted.
Column Differences
Excel has a very important function to find out differences between various rows. The function is called Column Differences.
To access the function
- Shortcut key - Press Ctrl+G.
- Click Special
- Under Home Tab click 'Find & Select'.
- Click Go to Special.
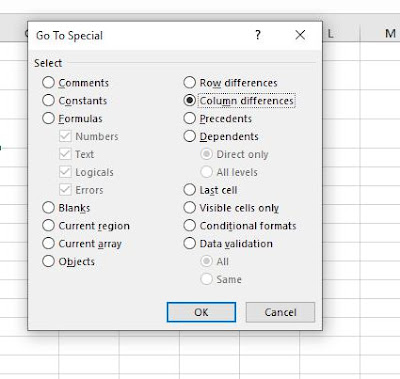 |
| ILL3 Column Differences |
 | |
| ILL4 Data Range |
You are requested to go through the above selected data range. Where B2 cell (White cell in the range) is default active. You can observe the various differences of data from one cell to another but mostly column wise. Of course some are common. After highlighting the data range.
Procedure
- Press Ctrl+G (Instead use Find & Select).
- Click 'Special'.
- Highlight the radio button associated with 'Column Differences'.
- Click Ok.
Result is as follows:
 | |
| Result |
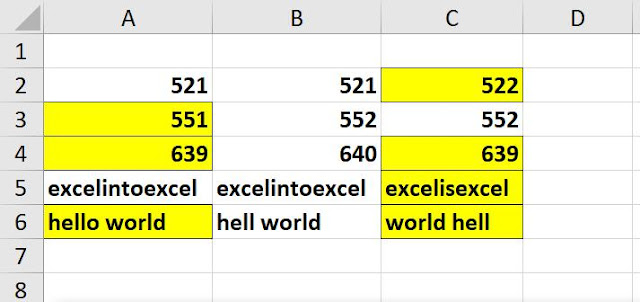
In case of the column C the contents are different C2 cell's content is different from cell's content of C3 & C4. Hence C3 & C4 has been highlighted.
In case of column differences the basis of comparison is row wise.
If we observe carefully the data range (ILL4) we will see the default active cell in the selected data range is cell B2 and the cell lies in 2nd row. As a result the basis of comparison is the 2nd row.
But if we move the active cell (white cell in ILL4) to 3rd row (by pressing Tab key) and follow the procedure result will be different.
 | |
| Changed Result |

No comments:
Post a Comment