Excel Table
Sorting
In the table below you can see some rows has been highlighted with the color Yellow.
We will follow these rows during sorting.
[Exercise File - Download]
We will follow these rows during sorting.
[Exercise File - Download]
- Serial
- Order Date
- Region
- Representatives (Rep)
- Item
- Units
- Unit cost
- Amount
We are going to sort the table by 'Date' of entry.
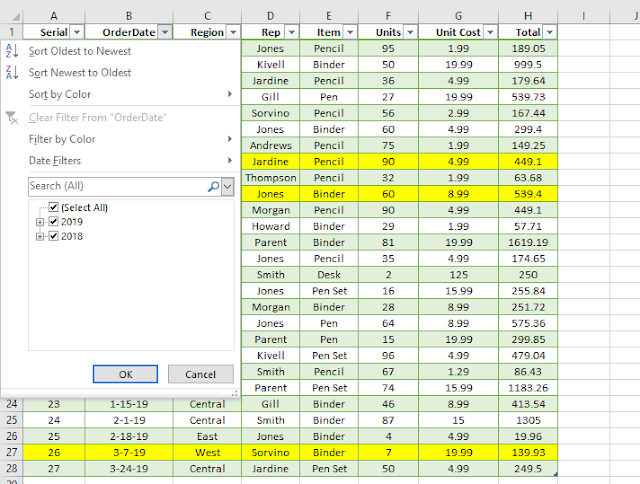
Click Order Date drop down arrow.
Sort Oldest Newest.
Sort Newest to Oldest.
Sort by color.
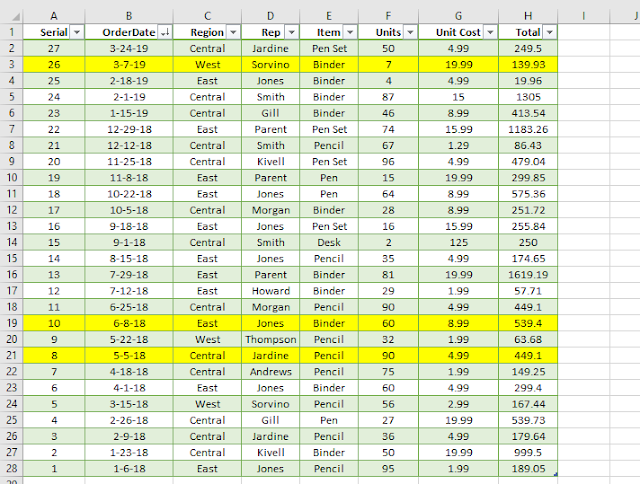 |
| Sorted newest to oldest |
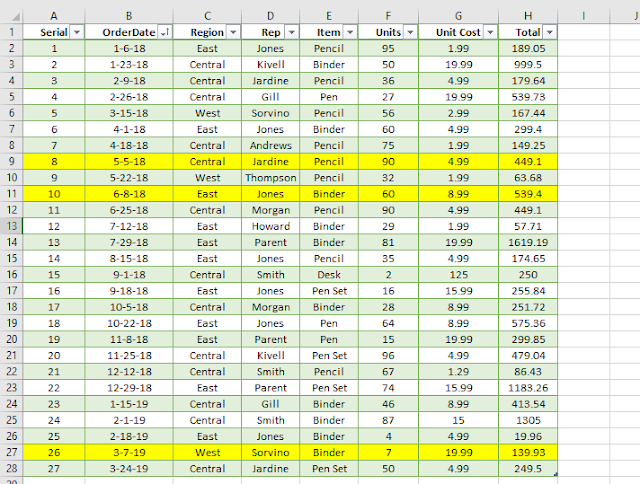 | |
| Sorted Oldest to Newest |
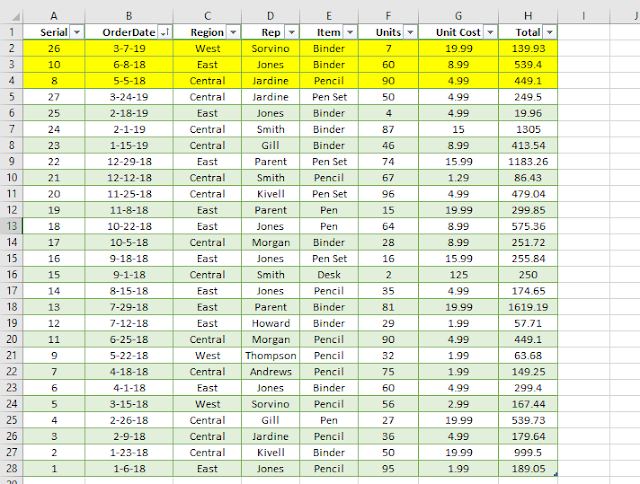 | |
| Sorted by color |
There is a limitation
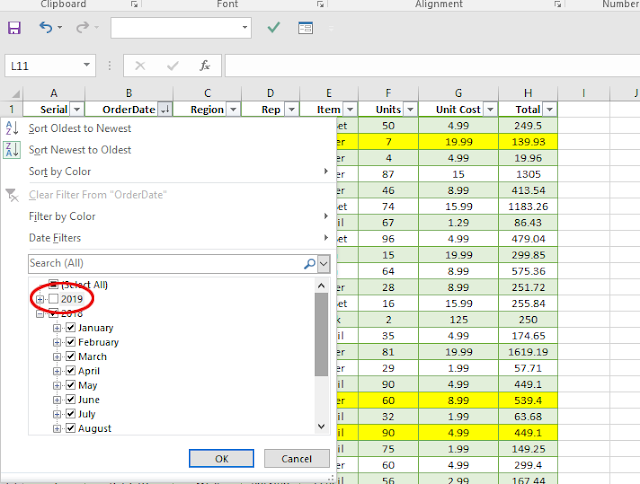
One cannot combine these two features (Marked with Red square in the above display). That is Oldest to Newest for 2018 can't be done. Though it can be done otherwise. If we want to exclude 2019 in the sorted result you need to check out the boxes relevant for 2019.
So even you uncheck the boxes relevant for 2019 and click Oldest to Newest, result will not exclude 2019. (May be it can't be done in Office 2016.)
Your sort can be very specific and precise.
Instance 1
Say we are going to exclude 2019 date entry in the final resultInstance 2
Say we want to sort
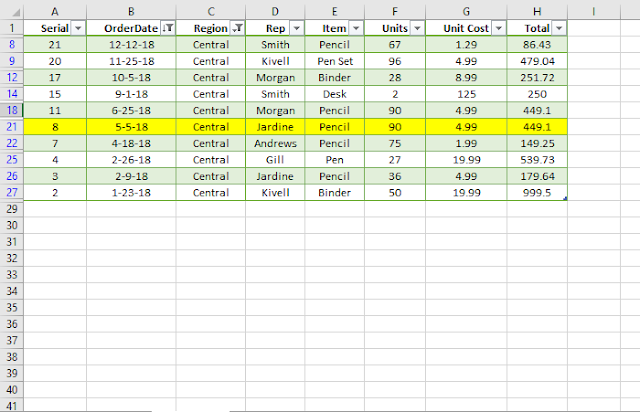
Ordering date 2018
Central Region's Performance
Now I believe you know how to Check / Uncheck from the drop down box.
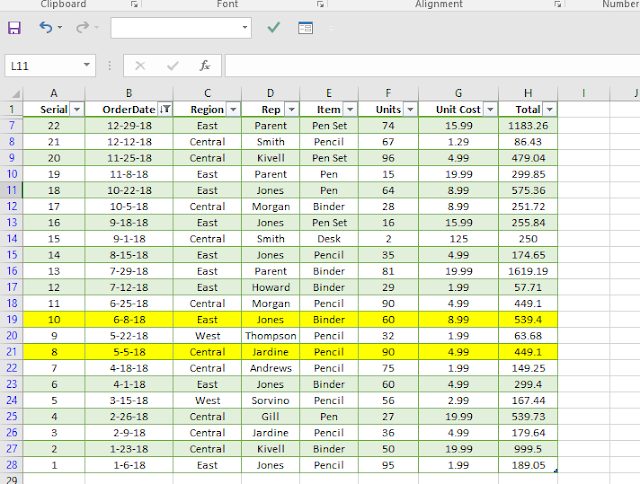
- Uncheck 2019 in the date column & click Ok
- Again after the first sort uncheck East & West in 'Region' column drop down box. Uncheck means excluding East & West from the sort result.
Final result is as follows.
Things to remember. How to know the table is sorted rather not in a full display mode?
 |
| Add caption |
Instance 3
Lets evaluate the performance of the representative 'Smith' in the year 2018 in the Central region.
- In the Order Date column uncheck 2019. We want to exclude 2019 from the sort.
- From the result, from the column 'Region' check 'Central' only and uncheck others, and click ok.
- Again with the result, from the column 'Rep' check only 'Smith' and uncheck others.
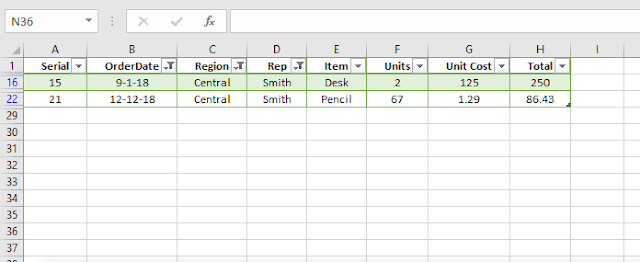 | |
| Result of Instance 3 |
Another very interesting aspect needs consideration. In the above resultant sort if we want to reset the sort. First you can reset Order date, after that you have to reset Rep then only you can reset Region. Try it with the downloaded data.
Instance 4
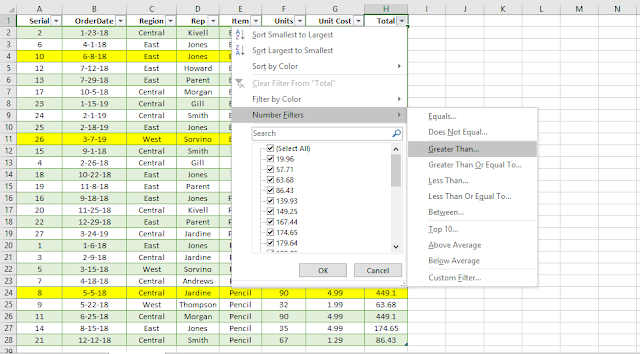
Lets sort the Total column with the value greater than 1000.
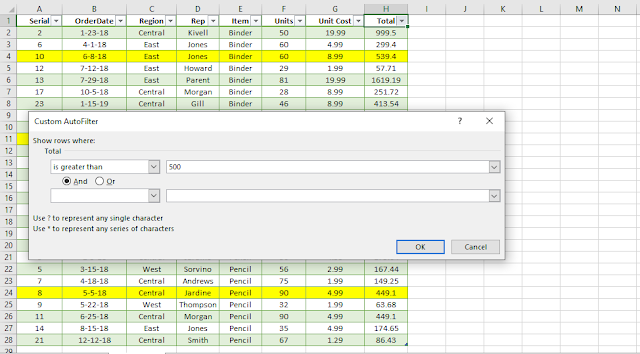
That is we are going to get only those rows whose Total is more than 500.
Step 1Click Drop Down Filter button of Total column.
Navigate to Number Filters.
Click Greater Than...
 |
| data tables |
Step 2
Result as follows.
Move Excel Table
After clicking inside the table hover your mouse cursor at the border of the Excel table you will see that the mouse pointer is tagged with a four arrow, it symbolizes that the table is to move.
Drag and drop at the desired location.



No comments:
Post a Comment