This post is the continuation of immediate previous post...
One can download the data sheet (we are going to follow) from the previous post.
One can download the data sheet (we are going to follow) from the previous post.
Instance 4
Query: Representation of region wise sales of Rep (Representatives) on the basis of Date. |
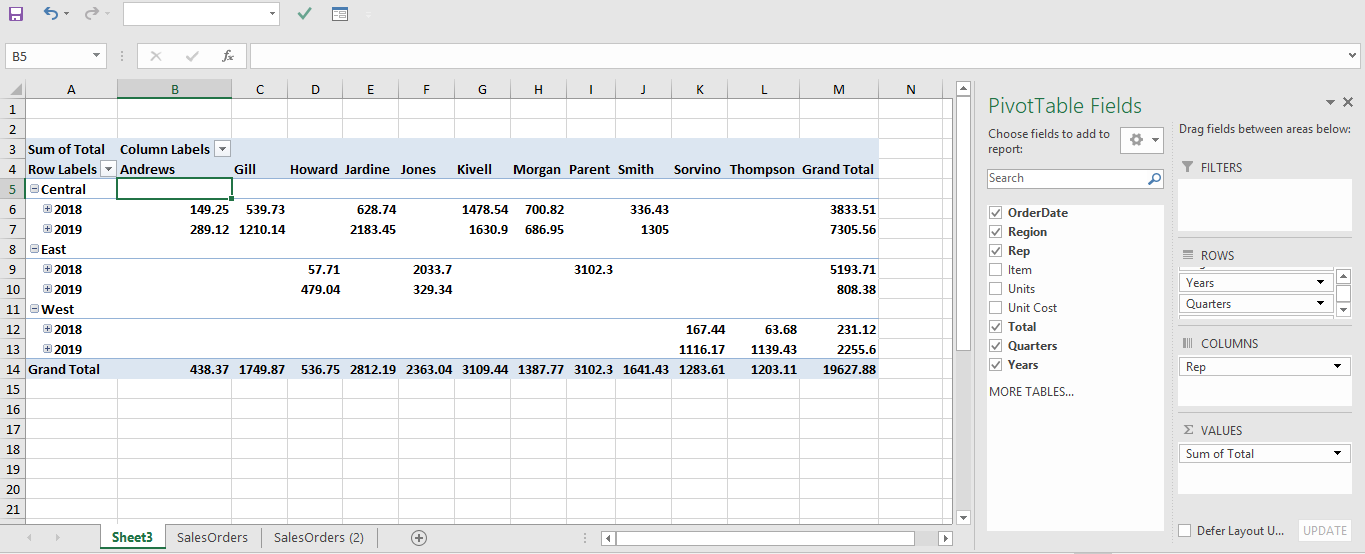
| Pivot Table With Date field |
- As we can see the Grand total is same as before.
- The check box associated with Order date is checked.
- Fields like 'Quarters' and 'Years' are generated automatically.
- Under Row area the fields like 'Years', 'Quarters' and 'Order Date' has been placed.

Another important thing can be noticed in the pivot table. Some +/- signs are visible in the table. Double clicking the + sign further disintegrates the data and table shows more precise information.
Modifying Pivot Table
Modify 1
Lets introduce sub totals.- Click inside the Pivot table, Design tab activates.
- Click Subtotals (Extreme Left)
- Click 'Show all subtotals at the top of the group.
 |
| Sub Totals introduced at the top of the group |
Modify 2
Lets remove Grand Totals for Row and Column
- Click inside the pivot table.
- Under Design tab, click Grand Totals
- Click 'Off for Rows and Columns'

Modify 3
By default all pivot tables are in Compact form.
Reporting layout can be changed.  |
| Tabular Form |
- Click inside the pivot table.
- Under the Design Tab click Report Layout.
- Click 'Show in Tabular Form'.
Modify 4
Just to enhance the readability of the report we can introduce blank rows after each records.
- Click inside the pivot table.
- Under Design tab click Blank Rows.
- Click 'Insert Blank line after each item'.

Other modifications

discretion.
Field Settings
We are about to dive deep into the pivot table's advanced features and functions.

One can get the dialogue box of Field Settings by right click on the pivot table and click 'Value Field Settings'.
With Field Settings we can modify the displayed data in the pivot table, of course without altering the source data.
For clear understanding we are going to use simple data. Logic is important.
 |
| Field Setting dialogue Box |

- The Data is in Table Format
- In the Day field 'Monday' is repeated twice.
 |
| Default pivot table with Grand total of Total |
Field Setting 1
Count the number of Data
- Click inside the pivot table and activate Analyze tab.
- Click 'Field settings'.
- Activate 'Summarize values by' tab if not activated.
- Highlight the option 'Count'
- Click Ok
 | |
| Total Record Count |
- Monday is 2 (since repeated twice)
- Grand total 5
Field Setting 2
Find the average of all records. (This is bit tricky)
- Click inside the pivot table and activate Analyze tab.
- Click 'Field settings'.
- Activate 'Summarize values by' tab if not activated.
- Highlight the option 'Average'
- Click Ok
 | |
| Field settings Average |
Field Setting 3
Lets find the Maximum out of the field- Click inside the pivot table and activate Analyze tab.
- Click 'Field settings'.
- Activate 'Summarize values by' tab if not activated.
- Highlight the option 'Max'
- Click Ok
 | |
| Field setting Max |
- As per 'monday' record 56 is max
- As per total record 65 is chosen as the maximum of all.
- Row label is changed to 'Max of Total'.
Field Setting 4
Finding the Minimum Value is similar to maximum value, rather the result is just the opposite.
Field Setting 5
Lets find the product of all.
- Click inside the pivot table and activate Analyze tab.
- Click 'Field settings'.
- Activate 'Summarize values by' tab if not activated.
- Highlight the option 'Product'
- Click Ok
 | |
| Field setting Product |
- For Monday record the product of 56x47 is displayed.
- Grand total is the product of all records including 2632.
Field setting 6
Count the number of records.
For these data source 'Count' and 'Count numbers' are same.
Requires here no further explanation.
No comments:
Post a Comment