This post is the continuation of the immediate previous post.
A Simple data we are going to use in Field settings for Pivot table. You can copy this data in your Excel sheet and try.
A Simple data we are going to use in Field settings for Pivot table. You can copy this data in your Excel sheet and try.
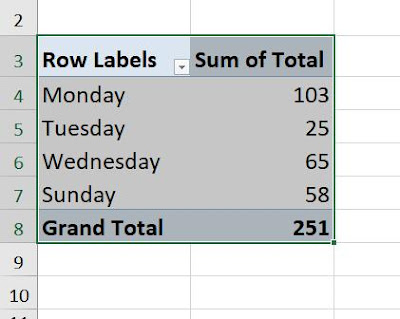
Default Pivot table from above data

Field Setting 7
- Click inside the pivot table and activate Analyze tab.
- Click 'Field settings', activate 'Summarize values by' tab if not activated.
- Highlight the option 'Stddev'
- Click Ok
Explanations:
- In the Value Field settings four settings are found.
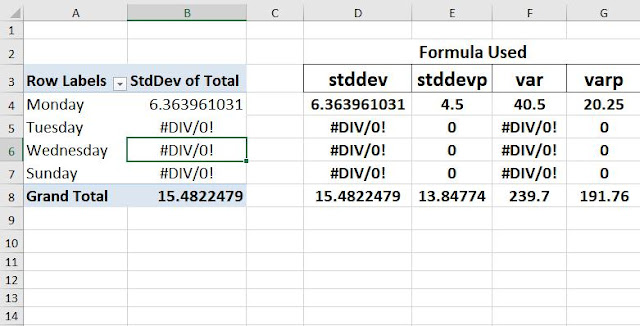
- In the Value Field settings in Pivot table these formulas are used namely stddev, stddevp, var, varp
- formula '=stddev(56,47)' results in 6.3639.... which is similar what Pivot Table adopts when we select Stddev from the list.
- In case of single digit there cannot be any deviation hence #Div/0!
- formula '=stddev(58,56,25,65,47)' results in 15.4822479.
- Similarly with stddevp and others we can get the tabulated results in the pivot table.
- How formula works is outside the purview of this post.
In the next instances we are going to use a different pivot table with little more data.
 | |
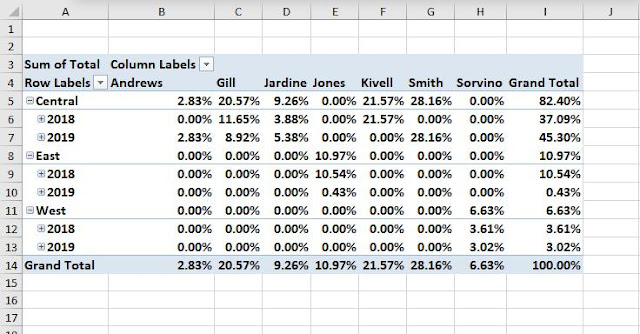
| Pivot table from above data. |
Field Setting 8
Lets represent the above table on the basis of '% of grand total'.
- Click inside the pivot table and activate Analyze tab.
- Click 'Field settings', activate 'Show values as' tab if not activated.
- From the drop down menu 'Show values as'
- Highlight the option '% of Grand Total'
- Click Ok
Explanations:
- 100% Grand Total is the sum of (6.63+10.97+82.40)%
- Similarly 82.40% is the sum of 37.09%+45.30%
Field Setting 9
Lets represent the above table on the basis of '% of column total'.
- Click inside the pivot table and activate Analyze tab.
- Click 'Field settings', activate 'Show values as' tab if not activated.
- From the drop down menu 'Show values as'
- Highlight the option '% of Column Total'
- Click Ok
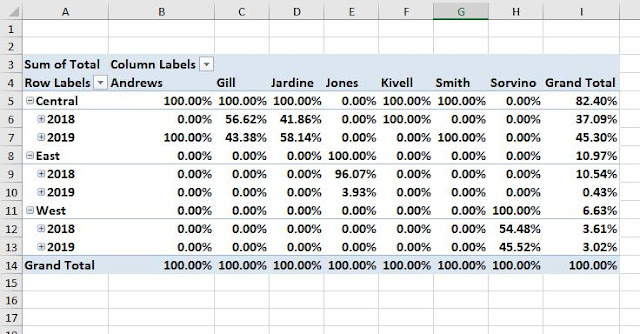
- All the column total is represented as 100%
- The performance of the representative 'Gill' in the Central region is 56.62% in 2018 and 43.38% in 2019. Say his performance declined in 2019.
- Grand total is same as before instance.
Field Setting 10
Lets represent the above table on the basis of '% of row total'.
- Click inside the pivot table and activate Analyze tab.
- Click 'Field settings', activate 'Show values as' tab if not activated.
- From the drop down menu 'Show values as'
- Highlight the option '% of Row Total'
- Click Ok
Explanations:
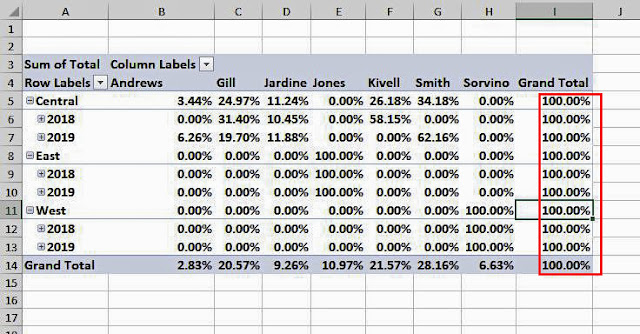
- All the row total is represented as 100 percent in the extreme right of the table.
- In case of Representative 'Andrews' his total performance on the basis of Central region is 3.44% where as his performance is 6.26% of the total performance in 2019.
- Sum total of all rows are 100%.
Field Setting 11
As it is apparent from the default pivot table that the Representative Smith's performance is the highest and best of the lot.
Lets present the above table on the basis of comparison of other representatives with Smith only.
- Click inside the pivot table and activate Analyze tab.
- Click 'Field settings', activate 'Show values as' tab if not activated.
- From the drop down menu 'Show values as'
- Highlight the option '% Of '
- Select Base field as Rep (Representative)
- Select Base Item as 'Smith'
- Click Ok
Explanations:
- I find this representation very logical.
- If we observe carefully we can see that representative Smith only performed in Central region in 2019. So comparison should be restricted to Central region for 2019.
- So Andrews, Gill & Jardine's performances are compared with Smith and represented in percentage format. Others are Null.
- Similarly Central region's Sub Total is also compared on the basis of same logic. Only Kivell performance is compared and represented on the basis of Sub Total. Since Kivell and Smith performed in the same region.
- Only Smith performance is represented in 100 percent.
Field Setting 12
Lets represent the Pivot table on the basis of percentages of Parent row total.
Here parent row signifies sub total values at the top.
- Click inside the pivot table and activate Analyze tab.
- Click 'Field settings', activate 'Show values as' tab if not activated.
- From the drop down menu 'Show values as'
- Highlight the option '% of Parent Row Total '
- Click Ok
Explanations:
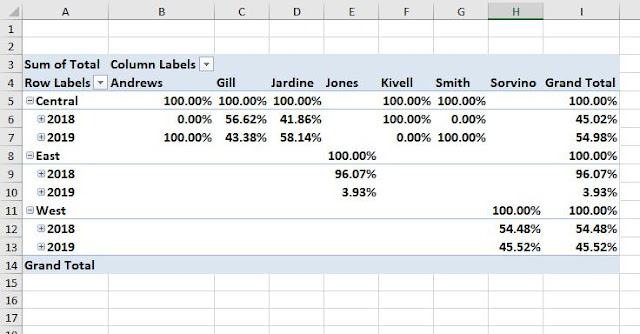
- Where there are performances the sub total is considered as 100% (all marked with Red)
- Say 56.62% and 43.38% together comprises 100%
- Grand Total is compared on the basis of 4634.03 data.
- Say 6.63% (As active Cell) arrives from dividing 307.37 by 4634.03 multiplied by 100, similarly 10.97% and 82.40% arrives in the same manner.
Field Setting 13
Lets represent the Default Pivot table data as 'Percentages of Parent Column Total'.- Click inside the pivot table and activate Analyze tab.
- Click 'Field settings', activate 'Show values as' tab if not activated.
- From the drop down menu 'Show values as'
- Highlight the option '% of Parent Column Total '
- Click Ok
Explanations:
- All the cells of the Grand Total column is marked as 100%
- Performances are measured on the basis of Grand Total Value.
- All the percentages total of any row is 100%
- Even total of Grand Total row is 100%
- All row totals are 100%
Field setting 14
Lets represent the pivot data as percentage of parent total.
- Click inside the pivot table and activate Analyze tab.
- Click 'Field settings', activate 'Show values as' tab if not activated.
- From the drop down menu 'Show values as'
- Highlight the option '% of Parent Total'
- Select the Region as Base Field
- Click Ok
- All the parents (Region totals for representatives) are presented as 100%.
- Data are represented in percentage.
Field Setting 15
Lets represent all the representatives performance data as a difference from representative Andrews.
- Click inside the pivot table and activate Analyze tab.
- Click 'Field settings', activate 'Show values as' tab if not activated.
- From the drop down menu 'Show values as'.
- Highlight the option 'Difference From'.
- Select the 'Rep' as Base Field.
- Select 'Andrews' as Base Item.
- Click Ok
Explanations:
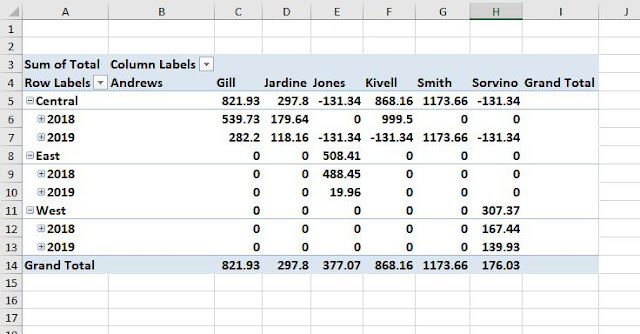
- Andrews has performed in Central region only. And he was the worst performer.
- There is no subtotal for Andrews in the Central Region.
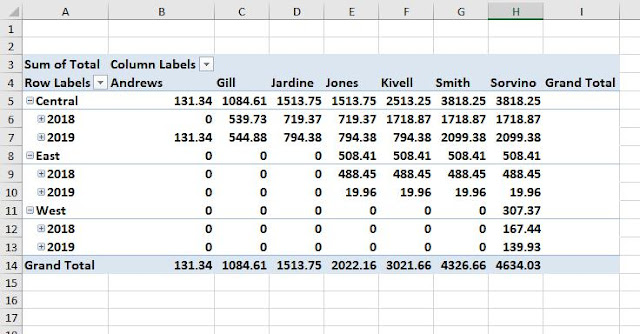
- Gill's difference is (953.27-131.34) 821.93 similarly others are projected in the subtotal zone.
- Negative values has been rejected.
Field Settings 16
Lets represent all the representatives performance data as a difference from representative Andrews in percentage format.
- Click inside the pivot table and activate Analyze tab.
- Click 'Field settings', activate 'Show values as' tab if not activated.
- From the drop down menu 'Show values as'.
- Highlight the option '% Difference From'.
- Select the 'Rep' as Base Field.
- Select 'Andrews' as Base Item.
- Click Ok
Explanations:
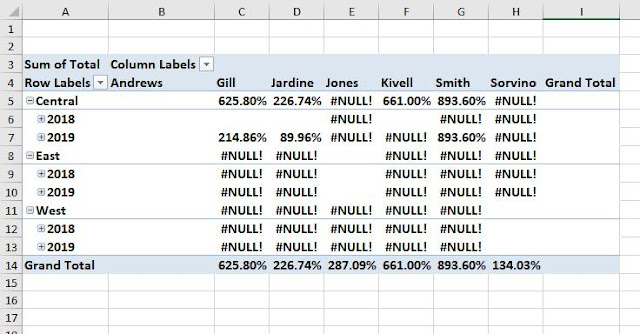
- Here Gill's difference in percentage format is 625.80% that is 821.93 (observe field setting 15) divided by 131.34 (Andrew's Performance) and multiplied by 100. That is 821.93/131.34*100 result is 625.80%
Field Settings 17
Lets represent all the representatives performance in running total mode.
- Click inside the pivot table and activate Analyze tab.
- Click 'Field settings', activate 'Show values as' tab if not activated.
- From the drop down menu 'Show values as'.
- Highlight the option 'Running Total in'.
- Select the 'Rep' as Base Field.
- Click Ok
Explanations:
- Grand total column is hidden.
- Running total is total is easy presentation.
- Say in Central 131.34, 131.34+953.27=1084.61,1084.61+429.14=1513.75 so on
Field Settings 18
Lets represent all the representative's performance in running total mode and in percentage format.
- Click inside the pivot table and activate Analyze tab.
- Click 'Field settings', activate 'Show values as' tab if not activated.
- From the drop down menu 'Show values as'.
- Highlight the option '% Running Total in'.
- Select the 'Rep' as Base Field.
- Click Ok
Explanations:
- Observe the previous table under the head Field Settings 17.
- In the Central region Andrews performance is 3.44% - is the percentage of 131.34 of 3818.25. Similarly 28.41% - is the percentage of 1084.61 of 3818.25 and so on.
Field Settings 19
Lets rank the performance of representatives from Smallest to Largest rather worst to best.
- Click inside the pivot table and activate Analyze tab.
- Click 'Field settings', activate 'Show values as' tab if not activated.
- From the drop down menu 'Show values as'.
- Highlight the option 'Rank Smallest to Largest'.
- Select the 'Rep' as Base Field.
- Click Ok
Explanations:
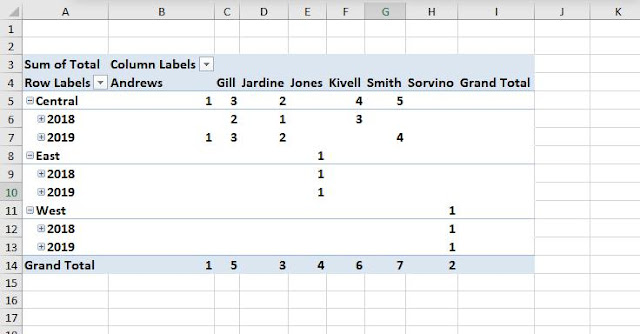
- Andrews is the worst performer ranked as One (since smallest to largest) under grand total.
- Smith is the best performer ranked as Seven (since smallest to largest) under grand total.
Field Setting 20
Lets rank the performance of representatives from largest to smallest rather best to worst.
- Click inside the pivot table and activate Analyze tab.
- Click 'Field settings', activate 'Show values as' tab if not activated.
- From the drop down menu 'Show values as'.
- Highlight the option 'Rank Largest to Smallest'.
- Select the 'Rep' as Base Field.
- Click Ok
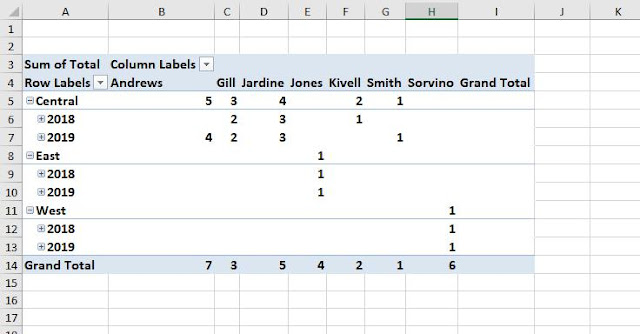
- Representative Smith is the best performer and ranked as one in grand total.
- Representative Andrews is the worst performer of all and ranked as seventh in grand total row.
Field Setting 21
Index setting
Calculation is as follows
(Value in Cells X Grandtotal of Grand Totals)/(Grand Row Total X Grand Column Total)
- Click inside the pivot table and activate Analyze tab.
- Click 'Field settings', activate 'Show values as' tab if not activated.
- From the drop down menu 'Show values as'.
- Highlight the option 'Index'.
- Click Ok
- 1.213652851 is (131.34 X 4634.03)/(3818.25 X 131.34)
- 2.207332641 is (131.34 X 4634.03)/(2099.38 X 131.34)
- If all value in the pivot table are equal each index will be 1
- If an index less than 1 it signifies that it is less important.
- If an index more than 1 it signifies that it is more important.
- Decimal places can be reduced.






No comments:
Post a Comment